Introduction
To Waste Prevention And Recycling
Paper # 45362
Marjorie J. Clarke
Scientist in
Residence
Abstract
Waste prevention and recycling (and composting) comprise the top half of the integrated municipal and medical waste management hierarchy of solutions. This brief overview, intended for those new to the field, addresses the solid waste management (MSW) hierarchy, the concept of integrated solid waste management, basics of waste composition and how this relates to reducing waste generation, recycling and composting, methods of waste prevention and recycling, and relative costs. Specific waste prevention and recycling methods, including legislation, government programs, incentives will be described.
Introduction
In the 1980s local jurisdictions across the
EPA’s 1989 Agenda for
Action[1] endorsed
the concept of integrated waste management, by which municipal solid waste is
reduced or managed through several different practices, which can be tailored
to fit a particular community’s needs.
The components of integrated management are:
1. preventing the generation of waste at the source
2. reuse, repair, refurbishment
3. recycling (usually some paper, metals, glass and plastic)
4. composting of organics (food waste, yard waste, sometimes paper)
5. waste-to-energy (incineration of wastes with or without prior separation of recyclables)
6. landfilling of residues from processing, and of unprocessed waste
These are arranged in order of priority in a hierarchy according to environmental
benefit/cost. Some states enacted legislation
requiring localities to implement long-term integrated solid waste management
plans. These plans were to put the solid
waste management hierarchy into practice to achieve goals for recycling and
source reduction by certain dates. At present, 58% of U.S. MSW is landfilled
down from 83% in 1986. Though source
reduction is at the top of the hierarchy, the source reduction goals for the
U.S are not particularly promising -- with nonspecific goal for the
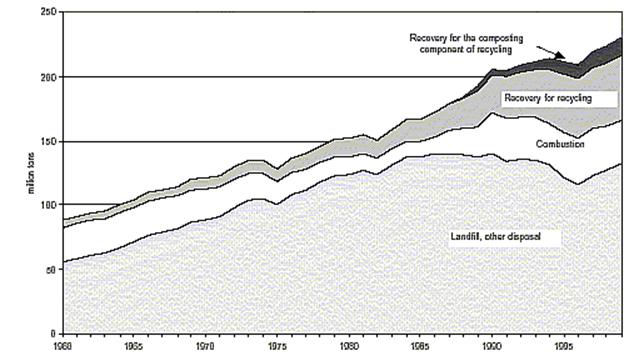
Fig 1. Municipal Solid Waste Management 1960-1999
Waste Generation
Before waste can be prevented, it is important to understand how much and what types of wastes are generated. As of 1999 Americans generated 230 million tons of municipal solid waste annually. (As recently as 1989, EPA had predicted the U.S. generation rate would be 193 million tons in 2000.) The waste stream in the U.S is growing as the result of two factors: we are experiencing a growth rate of about 1-2% per person per year in the amount of garbage that we are generating. There is an additional growth rate due to increases in population due to excess births over deaths plus immigration. The combined annual growth in generation amounted to 3% from 1998 to 1999.
A comparison of the U.S. garbage generation rate to some other countries in the western world shows that U.S citizens create between 3 1/2 and 6 1/2 pounds per person per day whereas the number is closer to 2 - 3 pounds per day in West Germany, Sweden, Norway, and Japan. [3]
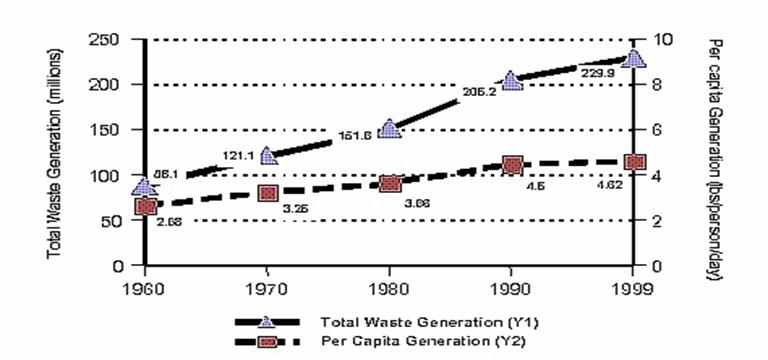
Over a period of forty years, the absolute quantity in MSW generation has nearly tripled and the per capita generation rate has more than doubled. (see Fig. 2) [4]
Fig 2. Waste Generation Rates from 1960 to 1999
Waste Prevention
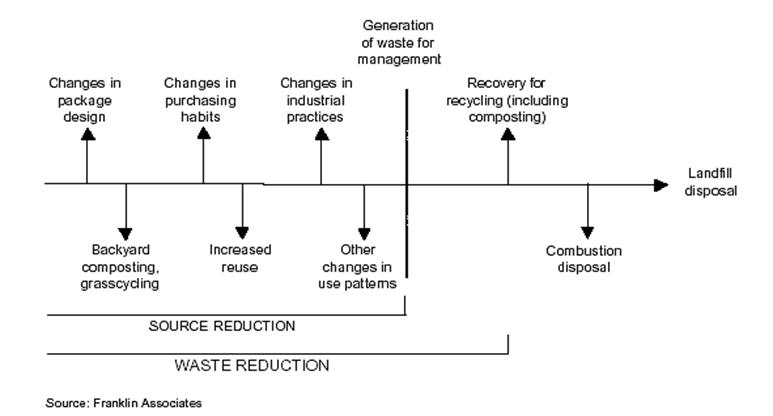
Waste Prevention" is defined as the reduction in the weight/volume and/or toxicity of the materials that are generated for disposal or recycling. It also refers to any change in the design, manufacturing, purchase, or use of materials or products (including packaging) to reduce their amount or toxicity before they become MSW. The means for preventing waste include reduction at the source can be accomplished through changes in industry actions (e.g., design, marketing), government programs (e.g., consumer education on being an envirionmental shopper, opportunities for product reuse, repair & donation), financial incentives (e.g., billing generators for garbage services by weight or volume) and legislation (e.g, requiring government to purchase more durable products, less packaging, etc). Some refer to waste prevention as source reduction and reuse, though others exclude reuse from that definition. Figure 3 shows how waste prevention fits into the overall scheme of solid waste management.
In addition
to the terms waste prevention and source reduction, there are other important
terms:
Reuse refers to methods for keeping a
product or package out of the waste stream by maintaining it in its original
function (e.g., by cleaning, repairing, and refurbishing). Spare parts might be added to restore full
function.
Source Expansion refers to increases in the rate of
generation of MSW. Source expansion is
the opposite of source reduction.
Durable Goods refers to longer lasting goods such
as major and small appliances, furniture and furnishings, carpets and rugs, and
consumer electronics. The U.S. Commerce
Department's definition is that durable goods are designed to last at least
three years.
Nondurable Goods refers to items having a lifetime of
less than three years, such as newspapers, magazines, office paper, telephone
directories, paper towels and tissues, paperboard, paper plates and cups,
plastic plates and cups, and textiles.
Figure 3
outlines several of the types of methods available to reduce or prevent waste
as compared with methods of dealing with waste once it is generated.
Fig. 3 Diagram of Solid Waste Management
Opportunities for Preventing Waste
It is interesting to
look at the waste stream from the point-of-view of the products and packaging
contained in it. This way, it is easy to
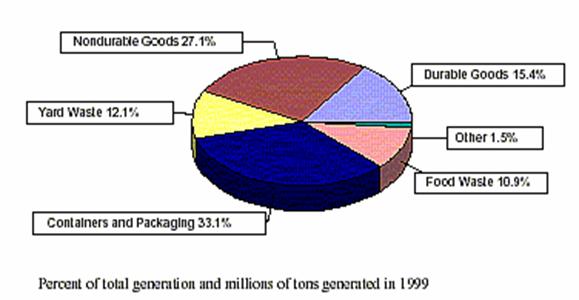
see target areas for waste prevention initiatives. Figure 4 shows a waste composition study for
the
Fig. 4
Products Generated in MSW - 1999
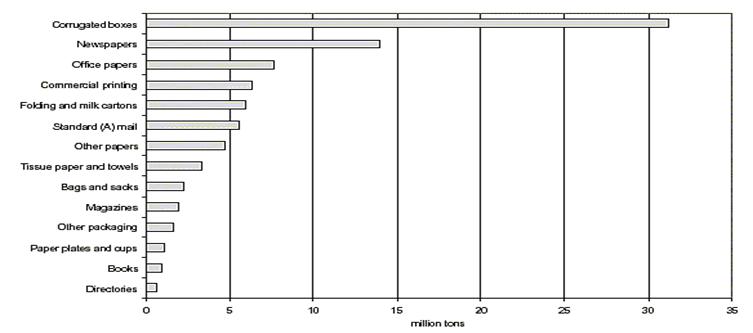
Figure
5 shows how by categorizing the products made from paper, opportunities for
reducing generation of paper waste are more clearly seen. For example, books, magazines, newspapers and
directories (e.g. telephone) are already starting to be replaced to some degree
by their electronic counterparts.
However, the full potential for this has not been realized for various
reasons (lack of portability, force of habit, lack of availability of all
printed matter online, prices not reflective of cost of publishing online, lack
of universal access to a computer, etc).
Office papers and commercial printing are being replaced by email, and
websites, but this is also not yet optimized as some people print their email
and others lack access to it. Boxes,
cartons, and other packaging together make up the lion's share of paper in the
waste stream. Methods to reduce
packaging needed to ship goods (e.g. reusable packaging) could make inroads,
though other ways need to be innovated.
Once these categories are taken out, it is clear that such items as
paper plates and cups, bags and sacks, and tissue paper and towels represent
small fractions. Initiatives to avoid
the need for cardboard would have greater importance in the short run.
Figure 5. Paper and Paperboard products generated in MSW in 1999 [5]
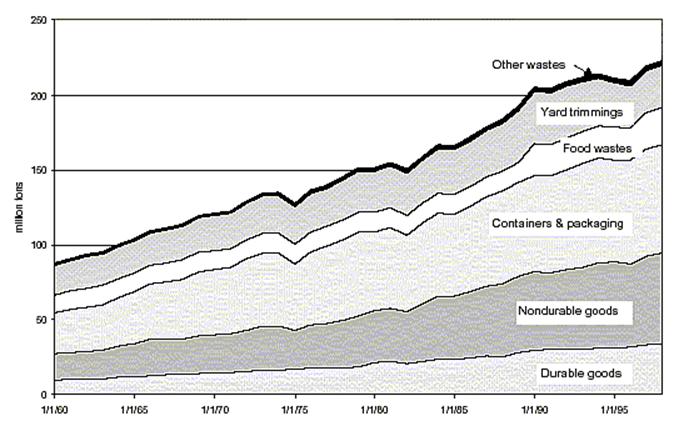
A historical perspective can also provide information on
which to focus waste prevention efforts.
Figure 6 demonstrates the growth rate of each of the major product
categories. The nondurable goods, the
durable goods, and the packaging categories have all grown the most in the
Figure 6 Products and packaging generated in MSW 1960-1999 [6]
Implementation of waste prevention initiatives sometimes requires participation by more than one sector. Industry can design a better product or package, but the consumer must buy it. The consumer might demand a better product or package, but industry must design and market it. Government may want to encourage waste prevention by instituting programs, but it must recognize this duality and work to stimulate correct actions in both the marketing and consumption of products and packaging.
Containers and
packaging
Lightweighting is one of the means that the packaging industry
has used to reduce the weight of containers and packaging. Reusable packaging (particularly shipping
containers) is another mechanism for reducing the materials used in manufacture
of disposable packaging. Packaging
liquid products in concentrated form also reduces the amount of packaging
needed. Bulk packaging also uses less
material per volume. Reducing the use of
toxic constituents in the packaging will reduce environmental costs both in the
manufacturing of the package as well as its disposal.
Consumers can assist in reducing the amount of packaging purchased and discarded by choosing products that are packaged in recyclable packaging (and then recycling it), concentrates, refills, bulk packaging, and not overly packaged goods.
Durable and Nondurable goods
Any initiatives that
increase the durability of products will delay the eventual discard of the
product into the waste stream. Some
popular approaches for waste prevention that can be practiced in the design and
manufacture of products and packaging are: [7]
Design for Environment
If manufacturers design
a product using superior materials, construction methods, quality assurance and
control, the product will last longer.
Even instructions that come with the product can be written to instruct
and encourage the owner in the means of keeping the product functioning
longer. Availability of reasonably
priced spare parts and repair professionals make products more repairable. Manufacturers can also design their products
to be easy to repair by utilizing parts that are easy to find or universally
used in other products. Products can
also be designed to be easy to disassemble and reassemble, easy to recycle,
even easy to compost. There are many
tools a manufacturer can use to Design for Environment:
Product Life Extension
If manufacturers design products to increase their
durability, repairability, and rechargeability,
these products will continue in use longer.
If companies design their products along classical lines, and reduce
planned obsolescence, fewer durable products will be discarded. Whenever
there is a warrantee on a product, the owner is more likely to have it
repaired, therefore more and longer warrantees will delay discard.
Material Life Extension
When manufacturers design products so that they can be easily disassembled, remanufactured, or recycled, this increases the likelihood that the products will indeed be either reused or recycled.
Material Selection
When manufacturers reduce the use of toxic substances in their products and packaging, any subsequent processing or disposal that could release toxic substances to the environment is reduced. If substitutes for precious natural resources are chosen, materials are conserved.
Reduced Material Intensiveness: Lightweighting
Manufacturers have already started to use less material in the design of certain packages while maintaining product integrity. This not only reduces the waste stream, but also lessens impacts from mining/logging resources and the production steps.
Process Management
Manufacturing processes can be modified to reduce the use of energy, water, and materials.
Not only can industry make changes to conserve materials, but those who purchase and use goods can also make behavioral changes to choose and reuse products and packaging. First, consumers need to be educated why it is important to purchase durables in place of disposables, and to evaluate the need for purchasing a new vs. a used, refurbished product, repair the one they have, or even reconsider whether they really need the product at all. If they do decide a new product is needed, consumers need to have been informed and motivated to donate, sell, recycle, or otherwise find homes for products with useful life that are no longer needed.
Improving the Reuse Industries
One of the complicating factors in attempting to move manufacturers and consumers towards more durable products is the decline of the repair and product maintenance industries. There are fewer retail establishments and fewer skilled people. Further, spare parts are not always easily or inexpensively available. In some cases, the manufacturers do not want spare parts to be available as repairing older models cuts into sales of new products. Another factor in the decline of the repair industry, is the rapidly increasing diversity of product designs.
At the root of the problem is that manufacturers are not
responsible for disposal of products they make.
Extended Producer Responsibility requirements, whereby manufacturers
have to pay for disposal of products and packaging they generate, have taken
hold in parts of
Nondurable goods
Some nondurables are consumer products which have a very short life span (e.g. single-use products) and are created to replace durable products for the sake of convenience: the product of today's throwaway society. Examples of these are disposable diapers, bags, shavers, pens, plastic eating utensils and dishes. EPA figures that each year Americans throw away 1.6 billion disposable pens, 2 billion disposable razors, and 16 billion disposable diapers (all of which could be avoided by using their reusable/refillable durable counterparts). These take up quite a bit of room in a solid waste disposal system (and consume far more resources than reusable alternatives). Disposable diapers contribute up to 3% of the waste stream. [8] In terms of source reduction, the cotton diaper that is reused is environmentally preferable to either the manufacture of many disposable or flushable diapers.
Other nondurable items are added to the waste stream because they are either designed and manufactured to be shoddy (e.g., furniture with stapled rather than dovetailed joints and toys made of thin, fragile, breakable (but inexpensive) plastics rather than wood). Yet other products are nondurable because they are not designed to be repaired or reconditioned very easily either by consumers or by repairmen (e.g., today's electronics, appliances, furniture).
Still other nondurables (e.g.,
computers, electronics) become obsolete or unfashionable in a short period of
time due to evolution of technology, and others (e.g., clothing, automobiles)
are designed from the start to become obsolete or unfashionable: planned obsolescence. Some businesses have gotten into the habit of
changing designs every year to maximize revenues and profits; and consumers in
our generally affluent society have responded to advertising that
new/fashionable items are most desirable by purchasing new products before the
old ones wear out (or before attempting to repair them).
Other durable goods, such as cameras, are being replaced with goods that are recyclable. However, from an environmental point-of-view, the amount of energy and materials used to transport, recycle, and bring back to market one person's lifetime purchases of such cameras considerably outweighs the resources needed for an equivalent number of durable cameras.
Reducing the use of toxic constituents in the product will reduce environmental costs both in the manufacturing of the package as well as its disposal.
Organics
Perhaps easiest of all
are methods to reduce the generation of food and yard waste, since organics
comprise the largest fraction of the waste stream and can be easily
co-composted. Residential backyard
composting, onsite composting in institutions and businesses, grasscycling ("Leave it on the Lawn"), kitchen
worm bins, and food reuse (i.e., providing consumable food not eaten in
cafeterias, restaurants, banquets to the poor via soup kitchens, etc.) are just
a few means of preventing food and yard waste from entering the waste
stream. Bans on yard waste in landfills
can provide an incentive to adopt these organics prevention methods.
Incentives
Behavioral studies have shown that education alone is not the best way to change behavior (e.g., purchasing patterns, recycling, etc.). Coupling informational and motivational materials with an economic incentive to do something (or disincentive not to do the opposite) works best. [9]
One popular method of creating an incentive, not only to
throw away less, but to recycle more, is Pay-As-You-Throw (PAYT), a means of
billing for solid waste collection and management services according to the
volume or weight generated. There are
5,000 communities across the
Environmental
Benefits of Waste Prevention
Implementing waste prevention initiatives is environmentally beneficial in several ways:
1. avoids or reduces natural and mineral resources depletion -- the materials needed to manufacture limitless quantities of nondurables just for the sake of convenience or fashion are limited and/or in decline (e.g., petroleum à plastics; trees/soil/space à wood products/paper; and bauxite à aluminum),
2. reduces lifecycle environmental impacts -- the air, water, and land resources required to absorb the impacts of the mining and transportation of virgin materials, and disposal of mining residues, manufacturing, marketing, as well as solid waste disposal (incineration, ash/garbage landfilling) are also limited and in decline.
3.
reduces toxics releases during production and disposal
(e.g., designing products and packaging not to use heavy metals as pigments,
designing batteries that eliminate or reduce heavy metal use, promoting products that have less chlorine,
such as chlorine-free paper and non-PVC plastics)
Economics of Waste
Prevention - a case study
Garbage that is not produced does not have to be
collected or managed. For this reason
waste prevention is the most inexpensive solid waste solution. In
The Potential for Waste Prevention (Year 2000)
showed the tonnage and percent prevented for residential (250,000 tons, 7%),
institutional (90,000 tons, 10%), and commercial (330,000 tons, 9%). The
overall rate of prevention was just over 8%.
The proposed prevention program was expected to
produce reductions in NYC's waste stream of about 4% in 1995, and of about 7%
by the year 2000, when the program would be fully implemented. In the year
2000, this would amount to approximately 600,000 tons a year, composed
primarily of the following types of materials: office and computer paper,
corrugated cardboard, and mixed paper; grass; glass; and furniture and large
appliances (bulk waste). Based on calculations obtained by modeling the
City's proposed waste-management system with and without these prevention
programs in place, the "avoided costs" to the City's waste-management
system due to these reductions are estimated to be in the range of $87 to $92
million in the year 2000, or $700 to $800 million cumulatively between 1992 and
2010 (in then net-present-value terms).[13]
On the collection side, a reduction of 600,000
tons a year would have reduced collection costs by $26 to $29 million in the
year 2000 (because the number of truck shifts would have been reduced by 4 to
5%). Vehicle miles traveled would have been reduced by 1.6 million miles
per year, a 3% decrease, which would have reduced vehicular air emissions by a
comparable amount.
On the processing side, a reduction of 600,000
tons a year would have reduced facility capital and operating costs by $58 to
$60 million; required 750 million fewer gallons of water a year for rinsing
recyclables (by generators) and 100 to 200 million fewer gallons of water in
waste-processing facilities. It would
have reduced air emissions from recycling facilities by about 5%, from
waste-to-energy facilities by 6% (System A) or 7% (System B), from landfills by
18 to 22% (A,B), and from ashfills by 6-7% (B,A); reduce facility acreage
requirements by about 14 acres; demands on landfill capacity by about 15%, and
ashfill capacity by about 8%.
The estimated cost of a partial prevention
program (for backyard composting and public education) was $20 per ton in the
year 2000, while the full avoided cost of disposal was on the order of $140 per
ton for System A and $150 per ton for System B. As much as $120 to $130
per ton in prevention programs therefore could be added before costs would
exceed benefits. The effects of a more-effective-than-projected
prevention program and of a less-effective-than-projected program are
represented in Figure 17.2.1-1, which shows that prevention programs become
increasingly cost-effective as prevented percentages increase. The reason
for this is that larger prevented tonnages allow relatively greater reductions
in truck shifts and facility capacity; conversely, when reductions are smaller,
fewer savings are captured through reducing truck shifts and smaller or fewer
facilities.
Waste Prevention
Achieved
Table
1 shows that almost half of the waste actually prevented in 1999 was in the
food and yard waste sector, almost double its proportion in the waste
stream. Initiatives to prevent goods and
packaging from entering the waste stream lagged behind. It's also important to recognize that even
though over 50 million tons were reduced in 1999, the waste stream still
grew. This combination of trends
indicates that industry efforts to devise new ways to increase packaging,
introduce new disposable products, and move consumers away from durables to
disposables is outpacing efforts to go in the direction of materials
conservation.
Table
1. 1999 Source Reduction by Major
Material Categories[14]
|
Waste Stream |
Tons Source Reduced |
Percentage |
|
Durable goods (e.g. appliances, furniture) |
5,289,000 |
11% |
|
Nondurable goods (e.g., newspapers, disposables) |
8,956,000 |
18% |
|
Containers & Packaging (e.g., bottles & boxes) |
12,004,000 |
24% |
|
Other MSW (mostly organics - food, yard waste) |
23,793,000 |
47% |
|
Total Source Reduction (1990 baseline) |
50,042,000 |
100% |
Corrugated
cardboard boxes, for example, have been and continue to be lightweighted. There
is a limit to this, since the strength of boxes can only be compromised to a
certain degree. It is probable, however,
that the explosion of catalog, electronic, and Internet commerce has greatly
increased the use of corrugated cardboard boxes for transportation packaging to
homes and businesses. As a result, the increased use of these materials may
eventually outpace the effects of lightweighting.
In order to achieve real reduction in waste generation, the MSW growth rate must be stopped, and then some of the nondurable products must be replaced in the marketplace with durable, repairable, maintainable, and reusable products. Some of the excessive packaging must be replaced with packaging styles which use less material to contain the same quantity of product (e.g., bulk and concentrated packaging in single containers), and use materials which have high recycled content, are themselves easily recyclable (single material packaging). Opportunities for buying used goods, sharing durables among several owners, swapping, repairing and refurbishing goods at a reasonable cost need to increase. Perhaps most important of all, the development and marketing of new forms of egregious packaging (e.g., moving from triple- to quadruple-packaging of cookies), and useless, fad products (e.g., a talking fish on a wall plaque, mercury switches in childrens' sneakers) needs to stop.
Recycling
Recycling, the second major rung on the integrated solid waste management hierarchy, is actually a three-step process. In order for recycling to occur, recyclable materials must be separated into commodities, sold to a firm that will use the materials in the manufacture of new products or packaging, and then brought to market and sold to consumers.
The separation can take place at the source of generation (in the home, factory, institution), at a drop-off center, or at a central material recovery facility (MRF) designed for taking unprocessed MSW, sometimes called a "dirty" MRF because putrescible or unrecyclable waste is present. Alternatively, source separation can sort into major categories (blue bag -- metal, glass and plastics; green or clear bag -- types of papers), and brought to a clean MRF, one that is designed to sort recyclables only.
Remanufacturing secondary materials into new product/packaging, can take place at factories of all kinds. Sometimes refinement is necessary to prepare the materials for manufacture. Marketing and sale of recycled content products and packaging occurs on ordinary store shelves. There are federal executive orders, state and local legislation requiring the governments to purchase recycled content papers in many jurisdictions. Other legislation has attempted to expand this to other products and packaging. The larger the markets for recycled content products, the more inexpensive it becomes.
Legislation
Starting in the late 1980s many states and some localities
passed legislation requiring that certain recycling goals be met by certain
dates. Some legislation phrased the
requirements as goals and others as mandates. In those cases, for example,
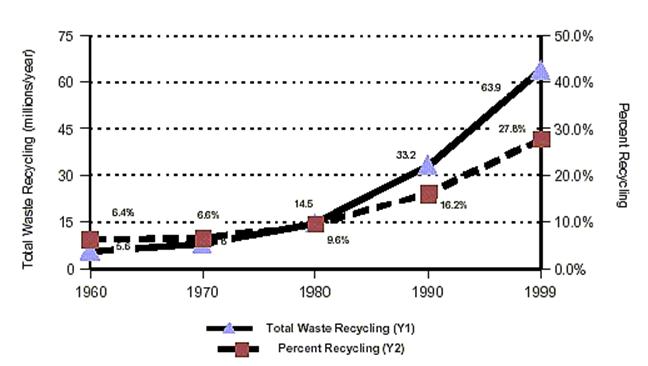
Since the 1980s recycling rates and tonnages took off achieving just under 30% and almost 64 million tons by 1999 (see Fig. 6). But despite this nearly tripling of the diversion rate and quadrupling recyclables collected over the last 20 years, recycling has not kept pace with the increase in waste generation. Recycling rates have also started to level off in recent years. Figure 1 shows that combustion, recycling and composting together have accounted for the additional waste generation since 1985 while landfilling remained more or less constant.
Figure 6
Importance of waste composition studies
In order to design recycling collection programs, it is important
to know the quantity of recyclables generated in the municipality in
question. Figure 7 shows this breakdown
for the
Figure 7. Recyclable Materials in MSW in the
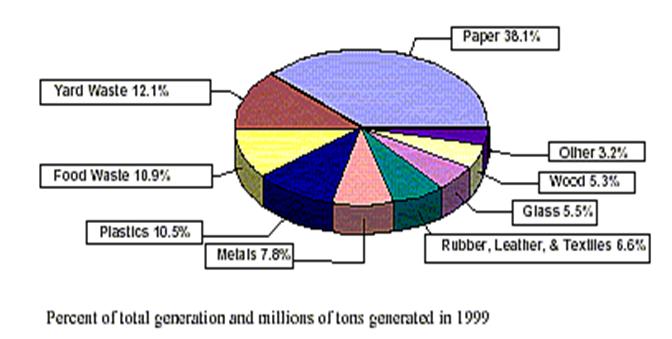
Figure 8 shows this breakdown for
There are some significant differences between the
The percentage of materials targeted multiplied by the participation or capture rate (those who actually recycle) is the diversion rate. The participation rate is affected by a number of factors including knowledge about what is and isn't collected for recycling, motivation to recycle, friends and neighbors who recycle, convenience of the program (e.g., frequency of pickup, location of pickup/dropoff), incentives to recycle, enforcement of fines for not recycling, and any barriers to recycling (e.g. having to buy bags or bins). To have an optimal rate of recycling it is necessary to optimize all these factors. Lacking just one of these factors can dissuade a person from participating in recycling.

Figure 8.
As mentioned above under waste prevention, Pay-As-You-Throw programs have a great potential for increasing recycling. In fact, when these programs provide recycling for free, they are the largest factor in increasing recycling rates. This is because people have the economic incentive to recycle. Another factor that increases recycling is increasing the frequency of collection to weekly from bi-weekly. [15]
Conclusions
On the one hand, recycling has been growing by leaps and bounds for a couple of decades, and thousands of communities successfully collect and market millions of tons of materials every year. Some progress has been made in implementing and measuring waste prevention. Since 1990 fifty million tons of products and packaging have been prevented. But much remains to be done to optimize these preferred options in the solid waste hierarchy. MSW generation rates are some of the highest in the world and are increasing at 3% per year, outpacing growth in incineration, recycling and composting combined. Recycling rates are leveling off and waste prevention programs have only reduced the rate of increase in the waste stream. The good news is that there are still many opportunities for waste prevention, reuse and recycling that have not been tried. The more expensive disposal and export alternatives become, the more economically attractive prevention and recycling become.
References